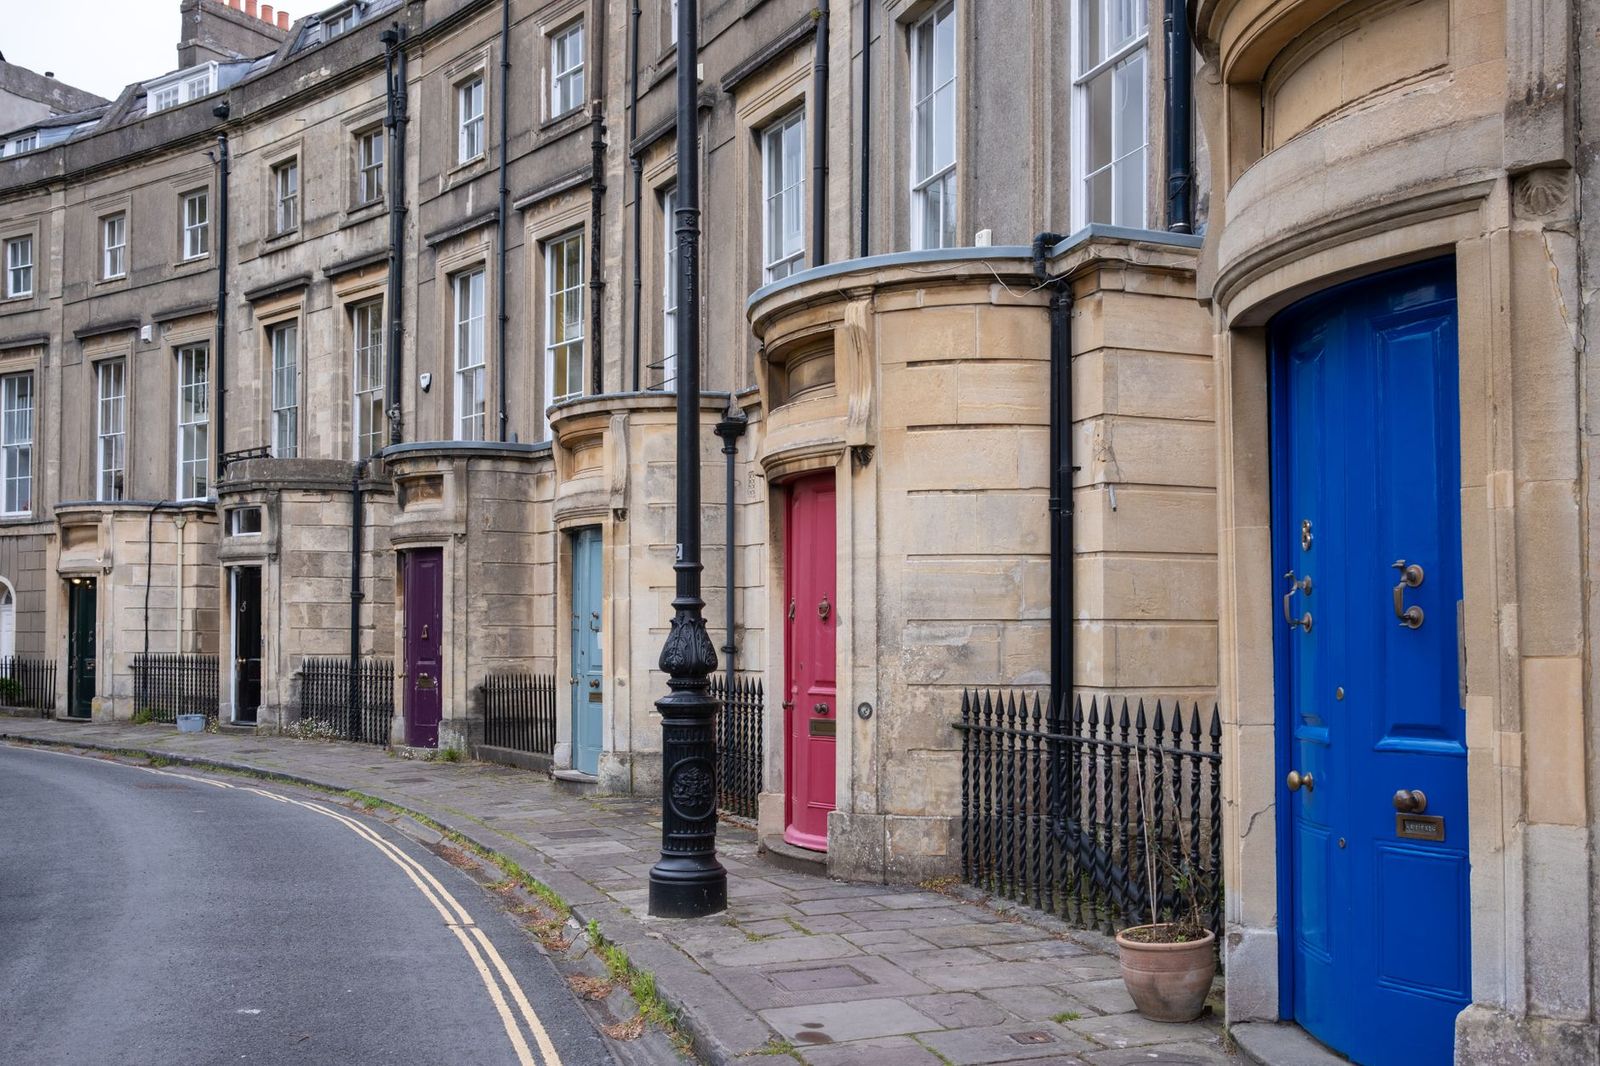
Conservation areas: the tax you pay for prettiness
A conservation area is the built-environment equivalent of a compliment you can't return. Somebody — usually the council, sometimes decades ago — decided your street was special enough to protect: the Georgian fanlights, the York-stone kerbs, the way the terrace steps down the hill. It is genuinely nice to live somewhere that has been judged worth preserving. The question nobody puts a number on is what that judgement costs you, and whether you get it back.
The estate-agent version of the answer is confident and wrong in both directions. One agent will tell you a conservation area is a premium postcode that "always holds its value better." The next will warn you it's a bureaucratic trap where you can't so much as change a window without a form in triplicate. Both are selling you a feeling. We wanted the number.
So we analysed mapped sold-price records inside and outside England's conservation areas, then asked two flat, checkable questions. Do homes inside a conservation area cost more? And do they grow in value faster?
The honest answers are yes, a bit and no, not really — and the gap between those two answers is the whole story.
First, why this is hard to measure at all
His Majesty's Land Registry records what a home sold for, but its Price Paid record is an address rather than a mapped point. To ask whether a sale was inside a conservation area, that address first has to be located confidently on the map.
For this study we matched sales to mapped homes using public address records and excluded uncertain matches rather than guessing. That lets the analysis work at property level — the same resolution that matters for a flood line, school catchment or, here, a conservation boundary.
The study is deliberately bounded. It covers 118,542 sold homes across eight English postcode areas — St Albans, Hull, Lincoln, York, Peterborough, Manchester and Liverpool among them. Of those, 19,241 sit inside a conservation area, spread across 66 distinct designations. It is a real sample, not a national census, and the methodology note below is blunt about where it does and doesn't generalise. But it's enough to test the two claims properly.
The premium is real — once you compare like with like
Start with the naive number, the one an agent would quote. Among recent sales (2022 onward), the median conservation-area home in our sample sold for £324,000, against £250,000 outside. A 30% premium. Case closed?
No. That number is almost entirely geography wearing a costume. Conservation areas are, by construction, the old and desirable bits — town centres, cathedral closes, Victorian villa quarters. Comparing a flat in the middle of York to a semi on its ring road tells you about York, not about conservation. Worse, the mix of homes is different: inside our conservation areas the stock skews to terraces and flats; outside it skews to semis and detached houses. Pool those together and you're comparing two different kinds of building in two different kinds of place.
So we controlled for both. We compared the same property type in the same postcode district — a conservation-area terrace in a given district against a non-conservation terrace in that same district — and only where we had at least ten sales on each side. Across 34 such like-for-like comparisons, the conservation premium was +14.2%, and it was positive in 26 of them.
Crucially, it holds across towns, not just in one gilded outlier. Comparing like with like, the premium ran to roughly +7.5% in Hull, +13.6% in Lincoln, +17.9% in St Albans, and +25% in both York and Manchester. Canterbury was the lone dissenter at −2.6%, on the thinnest slice of data. This is not one posh commuter belt dragging an average around; it's a broadly consistent signal. A conservation designation is worth something like a tenth to a quarter on the price of an otherwise-identical home nearby.
(It's worth noticing what the uncontrolled district figure does, because it's a lovely trap. Compare conservation to non-conservation across whole districts without holding property type constant, and the premium flips to roughly −6% — conservation homes look cheaper. That's the terraces-and-flats mix showing through: the protected streets hold more of the smaller, cheaper building types. Anyone quoting you a conservation "discount" or "premium" without controlling for what's actually being compared is quoting you noise.)
Now the claim that falls apart: faster growth
Here's where it gets interesting, because this is the part everyone gets wrong — us included, until the data argued back.
Take every home in the sample that sold at least twice, years apart, and compute how fast it grew in value between its first and last sale. This is the cleanest possible measure of appreciation, because it compares each house to itself — same building, same street, no mix effects. We have 4,690 such repeat-sale pairs inside conservation areas and 26,079 outside, most spanning about fifteen years.
Pool them together and conservation looks like a winner: 5.92% a year inside versus 5.54% outside. Not huge, but a real-looking edge — and exactly the kind of number that ends up on a listing as "historically strong capital growth."
It's a mirage. Break it down by town and the edge evaporates:
- St Albans: 6.33% inside vs 6.27% outside
- Lincoln: 5.69% vs 5.55%
- Hull: 4.92% vs 4.89%
- Canterbury: 7.32% vs 7.33%
- York: 5.72% vs 6.59% — conservation homes grew slower
Within a given town, a conservation-area home appreciates at essentially the same rate as its non-conservation neighbour — sometimes a hair faster, sometimes a hair slower. The pooled "advantage" was pure composition: conservation homes are over-represented in fast-growing southern towns like St Albans and under-represented in slower-growing ones, so lumping every town together lets the geography masquerade as a conservation effect. It's the same statistical sleight-of-hand as the price premium, running the other way. Once you compare like with like, there is no conservation growth premium in this data.
So the tidy investment thesis — buy protected, grow faster — is not supported. You pay more to get in. You do not compound faster once you're there.
What you're actually buying, and what it costs
If the premium isn't an investment edge, what is it? It's a price for amenity and for protection — and protection has a second invoice that arrives later, in the currency of what you're allowed to do.
Inside a conservation area, ordinary changes stop being ordinary. Demolishing so much as a boundary wall can need consent. The permitted development rights that let a homeowner outside the area add a rear extension, re-clad a wall, or swap the windows without asking anyone are curtailed — and councils routinely bolt on an Article 4 direction that strips those rights back further still. In our sample, at least 7.7% of conservation-area homes also sit under a mapped Article 4 direction — and because that layer is patchily recorded nationally, treat that as a floor, not a ceiling. Add the everyday friction: like-for-like materials, no uPVC where timber stood, a tree preservation order on the very tree that sold you the garden, and a planning department with opinions about your front door.
None of that is a scandal. It's the mechanism that keeps the street looking like the reason you bought on it. But it is a real, ongoing cost — in money, in time, and in the projects you quietly abandon — and it does not come with faster growth to offset it. That's the trade the headline premium is actually pricing: you pay upfront for prettiness and protection, and you keep paying in freedom. A tax, in other words, on the thing that made you fall for the place.
How to think about it if you're buying
The point of putting a number on this isn't to talk you out of a beautiful street. It's to make the decision with your eyes open:
- Expect to pay a premium of roughly 10–25% over an equivalent home nearby, and price it in — don't let an agent tell you it's a free upgrade. It isn't; it's in the number.
- Don't buy it as a growth play. On this evidence it won't outrun the ordinary house down the road. Buy it because you want to live there.
- Read the restrictions before you exchange, not after. Check whether the property is also listed, whether an Article 4 direction applies, and what the council's conservation-area appraisal actually says about alterations. If your plan depends on an extension or new windows, confirm you can get planning permission for it first — our guide to whether you need permission for an extension is the place to start.
That's the same discipline we'd apply to any locational factor — the map decides part of a home's value and a lot of its rules, and both are checkable in advance. It's why researching the area properly matters as much as researching the house: see how to research a neighbourhood before buying and the wider area guide. And when you're weighing what the place is genuinely worth versus what it's priced at, the honest starting point is always sold prices, not the sticker — which is the whole argument of what a home is actually worth and sold prices vs asking prices.
AskHouse checks the conservation, flood, planning and price record for a specific address rather than relying on an area average. You can ask it about a property directly, or explore the evidence in Explorer.
The prettiness is real, and worth wanting. Just know that the compliment has a price, that the price is already in the asking figure, and that the growth story attached to it doesn't survive contact with the data.
Methodology and limitations
Sources. HM Land Registry Price Paid Data, public address records and published conservation-area boundaries for England, analysed on 18 July 2026.
Sample construction. We matched Price Paid addresses to mapped residential properties and retained 118,542 detached, semi-detached, terraced and flat sales across eight postcode areas. Uncertain and name-only addresses were left unmatched rather than guessed, which means those properties are under-represented.
Conservation membership. A sale is classed as inside when its mapped property point falls within a published conservation-area boundary. 19,241 sample sales fall inside, across 66 distinct conservation areas.
- Raw premium: median sale price inside versus outside, from 2022 onward → £324,000 (n=2,271) vs £250,000 (n=14,188).
- Like-for-like premium: group 2022-onward sales by postcode district × property type; keep cells with ≥10 sales on each side (34 cells); take each cell's inside/outside median ratio → median premium +14.2%, positive in 26/34. Per-area medians (cells ≥8 each side): Hull +7.5%, Lincoln +13.6%, St Albans +17.9%, York +25.3%, Manchester +25.3%, Canterbury −2.6%. The uncontrolled district-only comparison (≥15 each side, 12 districts) returns −5.8%, illustrating the property-type composition effect.
- Appreciation: for each property with at least two sales two years apart, we calculated standard annualised compound growth between its first and last sale. Median growth was 5.92%/yr inside (n=4,690, IQR 3.77–7.95) and 5.54%/yr outside (n=26,079, IQR 3.45–7.45). Per-town medians (inside vs outside): St Albans 6.33/6.27, Lincoln 5.69/5.55, Hull 4.92/4.89, Canterbury 7.32/7.33, York 5.72/6.59.
- Restriction overlap: share of conservation-area sample sales also covered by a mapped Article 4 direction → 7.7% (1,475/19,241).
Limitations, stated plainly.
- This is not a national study. It covers eight postcode areas (St Albans, Hull, Lincoln, York, Peterborough, Manchester, Liverpool and Canterbury); conservation sales concentrate in six of them, and St Albans alone contributes a large share. The premium and appreciation figures describe these places, not every conservation area in England.
- Price Paid is England and Wales only and excludes many below-market transfers; we report medians throughout because means are distorted by outlier and commercial sales.
- Repeat-sales appreciation isn't quality-adjusted: a home that was extended or gutted between sales will show growth that isn't pure market movement. This affects conservation and non-conservation homes alike, but conservation restrictions may suppress such works inside the boundary — a reason to read the flat within-town result as, if anything, generous to the "faster growth" claim rather than harsh on it.
- The Article 4 layer is incompletely mapped nationally, so 7.7% is a floor on genuine permitted-development restriction, not a measured national rate.
- Conservation-area boundaries are used as published; a property very close to a boundary is classified according to that mapped line.
Ask the House about any property
Get grounded answers on the risks, value, planning, and energy behind any UK home — plain English, no jargon. Free to try.