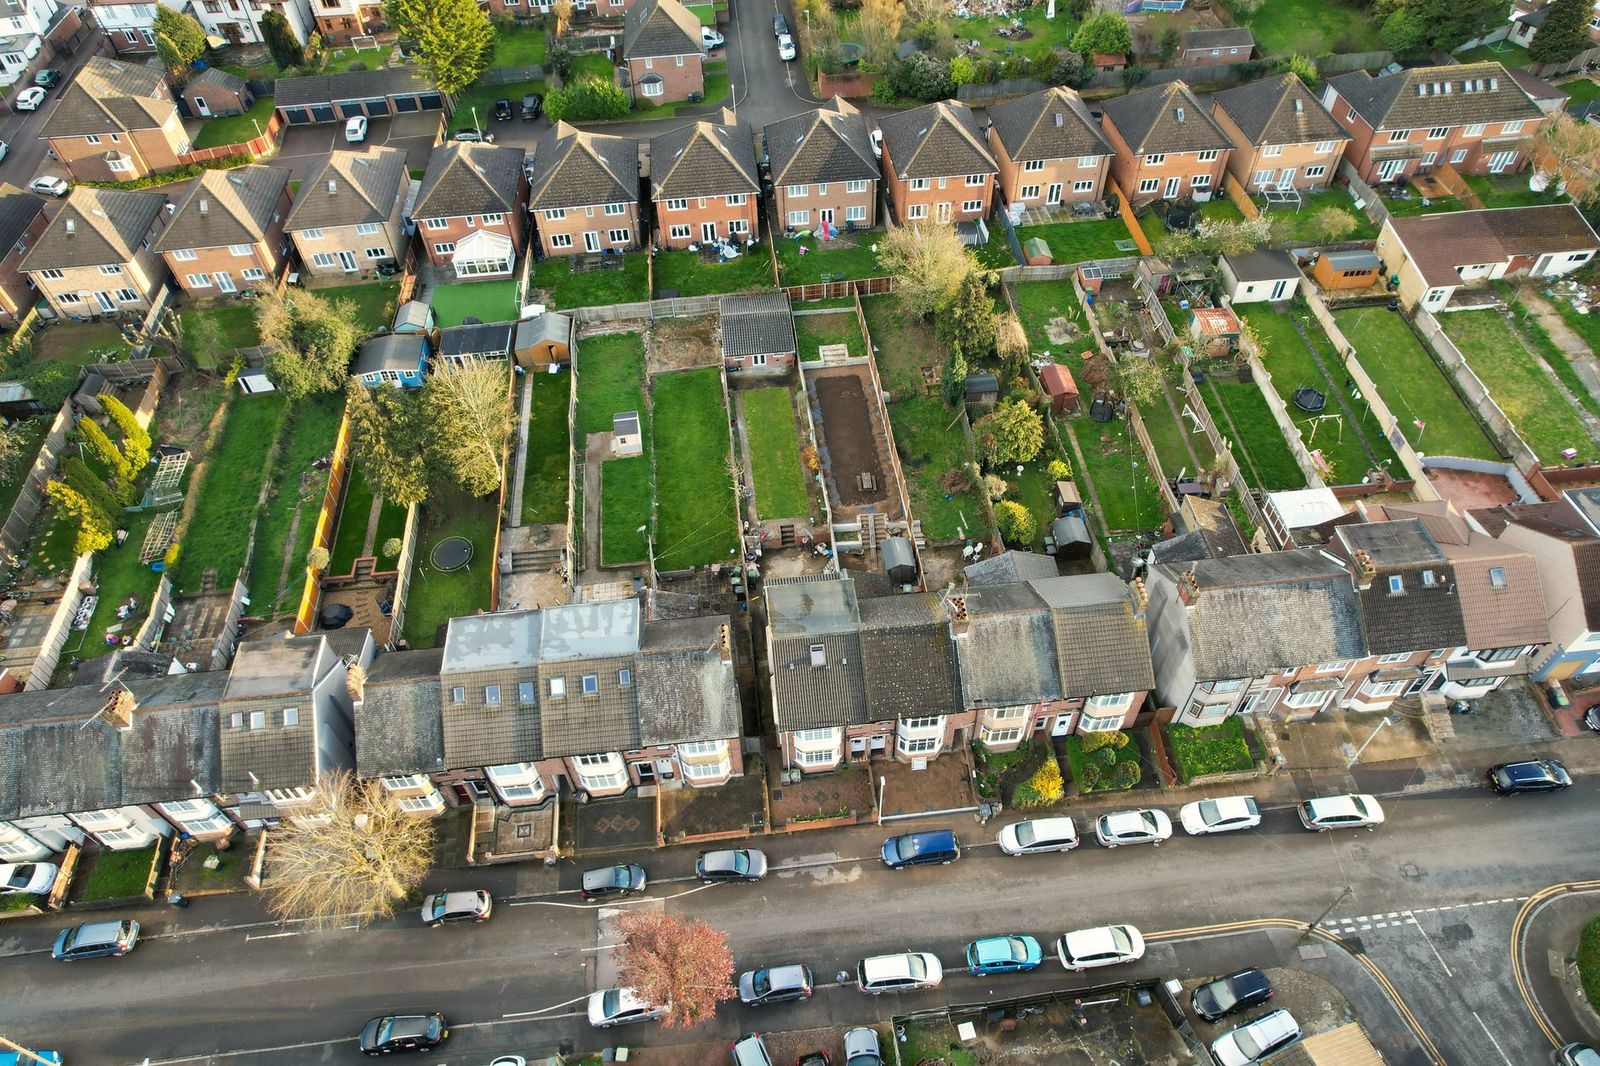
The postcode average is a lie
Type a postcode into any property portal and it will hand you a number: the average sold price for the area. It feels like knowledge. It is closer to a horoscope.
Here is the problem, stated plainly. We took HM Land Registry's full record of every registered sale in England and Wales — 31.3 million transactions — and asked a narrow question of one ordinary seaside postcode district: CT10, Broadstairs. What does the "average" hide?
In CT10, the dearest street has a median sale price of £1,266,000. The cheapest has a median of £110,000. Same postcode district. Same three-letters-then-two-digits that a portal collapses into a single headline figure. An 11.5x difference — £1.16m of daylight — between two streets you could walk between in ten minutes.
The postcode average for CT10 is about £360,000. It describes almost no street in it.
The average lies twice
The first lie is the one everyone half-knows: an average is a single point standing in for a spread. But it's worse than that, because the "average" you're shown is usually the mean, and the mean is the most manipulable number in property.
CT10's numbers make the point cleanly. Across 1,942 sales in the district since 2022:
- The mean sale price is £595,989.
- The median — the actual middle sale — is £360,000.
That £236,000 gap between mean and median isn't noise. It's a handful of clifftop mansions and a few commercial sales dragging the mean upward while the typical home sits far below it. If a portal quotes you the mean, it has quietly told you the neighbourhood is 65% dearer than the middle house really is.
You can watch this happen at street level too. Westwood Road in CT10 has a mean sale price of £4,847,462 — which would make it one of the most expensive streets in Kent. Its median is £293,750. One or two large commercial transactions on the road bent the mean into fiction. This is exactly why every figure in this piece is a median: medians shrug off the outlier that means swallow whole. When we re-ran the district on residential sales only — houses and flats, no shops or car parks — the median didn't move at all. It stayed at £360,000. The mean is the number that lies. The median is the one that behaves.
That's the first lie: which average.
The second lie is deeper, and it's the one the portal can never fix: a single number for a whole postcode district is the wrong resolution. Property value doesn't live at the postcode-district level. It lives at the street, and often at the individual house.
One district, top to bottom
Here is CT10, laid out as a ladder of street-level medians (each street with at least eight recorded sales since 2022):
| Street | Median sold price | Sales |
|---|---|---|
| North Foreland Avenue | £1,266,000 | 12 |
| Eastern Esplanade | £950,000 | 15 |
| Stone Road | £710,000 | 22 |
| Convent Road | £605,000 | 18 |
| Botany Road | £467,500 | 30 |
| — district median — | £360,000 | — |
| West Cliff Road | £311,500 | 38 |
| High Street | £195,000 | 30 |
| Fairfield Road | £141,500 | 14 |
| Church Court Grove | £118,750 | 18 |
| Grosvenor Road | £110,000 | 10 |
Find the district median in that table. It sits marooned in the middle, describing North Foreland Avenue and Grosvenor Road equally badly — which is to say, not at all. A buyer told "the average round here is £360,000" is being handed a number that is £900k light for one street and a quarter-million heavy for another.
This is not a Broadstairs quirk
The easy dismissal is that CT10 is unusual — a coastal town with a millionaires' clifftop bolted onto ordinary terraces. So we ran the same test on the whole country.
For every postcode district in England and Wales with enough recent activity to compare — at least five streets, each with at least eight residential sales since 2022 — we measured the gap between the dearest and cheapest street's median. That's 2,123 postcode districts. The result:
- The typical district has a £479,500 spread between its dearest and cheapest street's median.
- In 87.6% of districts, the gap is at least £250,000.
- In 46.8% — nearly half — the gap is at least £500,000.
- In the top tenth of districts, the spread exceeds £1.16m.
Read that again. In roughly nine out of ten postcode districts in England and Wales, there is at least a quarter of a million pounds between the median house on the best street and the median house on the worst — and the portal averages both into one soothing number and hands it to you.
The postcode average isn't a rough guide with some error bars. It is, in the strict sense, a lie of omission: it works by hiding the single most important thing about where a house is.
Why streets diverge
Streets aren't priced differently by accident, and the reasons rarely respect the postcode boundary. The usual suspects:
- A school-catchment line running down the middle of a road. One side feeds the outstanding secondary; the other doesn't. The premium can be six figures for two houses that share a party wall.
- A flood zone edge. The Environment Agency's flood polygons don't follow streets — they follow contours and watercourses. A house 40 metres from its neighbour can sit in Flood Zone 1 while the neighbour sits in Zone 3, with the mortgage and insurance consequences that follow.
- A conservation area boundary. Inside it, the streetscape is protected and often prettier — and your permitted development rights are curtailed. That tension prices differently on each side of the line.
- Aspect and outlook. In CT10 the dear streets — North Foreland Avenue, Eastern Esplanade, Stone Road — cluster on the clifftop with the sea in front of them. The cheap ones sit inland by the railway. Sea view is not a postcode; it's a plot.
- Tenure. A street of leasehold flats and a street of freehold houses can be neighbours and price a world apart — and the leasehold's ground rent and service charges keep pricing it, long after completion.
We'll be honest about the study's limits. It does not attribute each street's result to a particular driver such as flood risk, catchment or conservation status. The mechanisms above are established drivers of intra-district variance and the geography of CT10 is public record; precise attribution street by street is not a claim this analysis makes.
What to do instead
The fix isn't a better average. There is no average fine enough. The fix is to stop asking about the postcode and start asking about the street — and then the house.
Every home has a Unique Property Reference Number — a UPRN — and behind it sits the specific, checkable stuff that the postcode average erases: what this street actually sold for, which side of the flood line and catchment boundary this plot falls on, what the EPC band really implies for running costs, what planning history the road carries. That's the resolution property decisions are actually made at, and it's the resolution we built Ask the House to answer at. You can ask it about a specific address rather than a postcode, or read more about what actually drives a home's value and the questions buyers keep asking.
The portal average will always be there, comforting and wrong. Treat it as the beginning of the question, never the answer.
Methodology
Source. HM Land Registry Price Paid Data, the public record of registered residential and commercial sales in England and Wales: 31,299,627 transactions dated 1 January 1995 to 31 March 2026.
Recency filter. All price figures use sales dated 2022-01-01 onward, to reflect the current market rather than a 30-year blend.
Street and district figures (CT10). Street-level figures report the median and include only streets with at least eight sales since 2022, so one transaction cannot set the number. The CT10 district median (£360,000) and mean (£595,989) use 1,942 qualifying sales. Restricting the sample to detached, semi-detached, terraced and flat sales leaves the median unchanged at £360,000 across 1,823 sales, while the mean falls to £410,157 — evidence that the median is robust to outliers and the mean is not.
National figure. For the 87.6% / £479,500 result, we grouped every sale since 2022 (residential types only) by outcode and street, took each street's median (streets with ≥ 8 sales), then for each outcode measured the spread between its dearest and cheapest street median. We kept only outcodes with at least five qualifying streets, so the comparison is meaningful — 2,123 postcode districts. Across those: median spread £479,500; 90th-percentile spread £1,165,120; 87.6% with a spread ≥ £250,000; 46.8% ≥ £500,000.
Limitations, stated plainly.
- Price Paid excludes most sales below full market value (some transfers, repossessions and right-to-buy discounts are flagged or omitted), and it covers England and Wales only — Scotland and Northern Ireland run separate registers not included here.
- We report medians throughout precisely because means are distorted by commercial and outlier sales; the Westwood Road example (mean £4,847,462, median £293,750, both over the same 24 sales) is the reason.
- Street names are free text and occasionally inconsistent; a rare mis-keyed entry may split one street into two labels, slightly understating counts without affecting the reported medians.
- The causes of street-level variance (catchment, flood, conservation, aspect, tenure) are described from established drivers and the public geography of the area, not attributed property by property in this study.
The figures can be reproduced from the public Price Paid dataset using the scope and thresholds described above.
Ask the House about any property
Get grounded answers on the risks, value, planning, and energy behind any UK home — plain English, no jargon. Free to try.