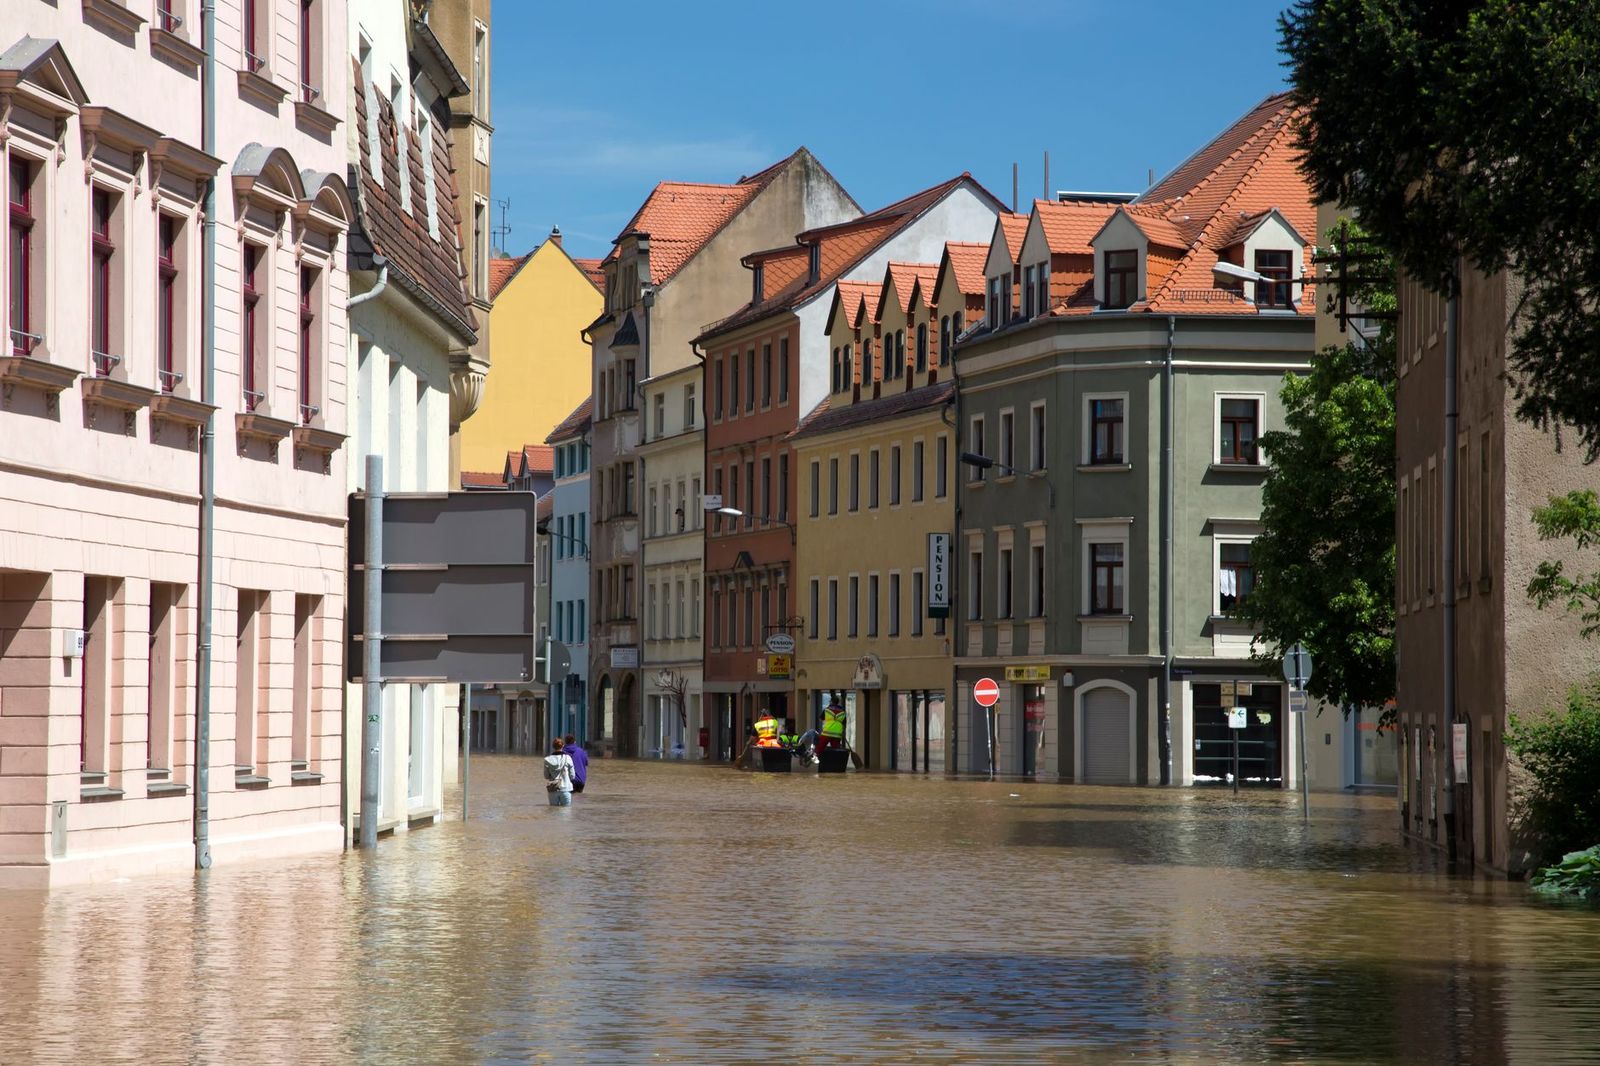
We put 69,671 sold homes on the flood map — here's what flooding does to the price
Everyone knows flood risk is supposed to hurt a house's value. Almost nobody can tell you by how much, because the honest answer requires two things buyers rarely have together: a large pile of real sold prices, and a way to put each one on the flood map to the nearest doorstep. This study brings those two records together.
The short version: on the homes we could place precisely, sitting in a flood zone 3 — the Environment Agency's highest-probability band — is worth roughly a quarter to a third off the price of an otherwise-similar home on higher ground in the same town. That last clause is where most flood-and-price commentary quietly falls apart, so it's where we'll spend most of our time.
How you place a sold price on a flood map
Land Registry publishes what every home in England and Wales sold for, going back to 1995 — 31.3 million transactions. But the sold-price record carries no coordinates. It's postcode plus a house number and a street name as free text, which is useless for asking the one question that matters here: is this exact house inside the 1%-a-year flood outline, or 200 metres uphill of it?
We matched each sale to a precise property location using public address records, retaining only confident matches and leaving uncertain addresses out rather than guessing. We then classified each property against the Environment Agency Flood Map for Planning to identify its flood zone.
That gave us 69,671 sold homes placed on the flood map across three English postcode areas: Kingston upon Hull, St Albans, and part of coastal Kent. It is not the whole country — we'll be precise about that at the end — but it is tens of thousands of real, individually-located transactions, which is enough to catch the effect and, more importantly, enough to catch the mistake almost everyone makes measuring it.
The mistake: comparing Hull to St Albans
Here's the tempting version of the analysis. Take every home, split by flood zone, compare the medians:
| Flood zone | Homes | Median sold price |
|---|---|---|
| Zone 1 (low) | 58,262 | £204,000 |
| Zone 2 (medium) | 1,825 | £119,500 |
| Zone 3 (high) | 9,584 | £113,000 |
Read naively, that's a 45% flood discount, and you could write a scary headline from it. It would be nonsense. Almost every zone-3 home in this sample is in Hull — a city where most of the built-up area sits below the high-tide line of the Humber, and where houses are cheap for a hundred reasons that have nothing to do with flooding. Almost every expensive zone-1 home is in St Albans, a commuter town where they are dear for a hundred reasons that also have nothing to do with flooding. That table isn't measuring flood risk. It's measuring the distance between Hertfordshire and the East Riding.
This is the same trap as the postcode average: the moment you compare homes that differ in more than the one thing you care about, the number you get is a fiction. To measure what flooding does to a price, you have to hold the town constant and let only the flood zone vary.
The honest number: same city, different flood zone
Hull is the ideal natural experiment, because it contains both. 36% of the Hull homes we placed sit in flood zone 2 or 3, and 31% in zone 3 alone — one of the most flood-exposed housing stocks in England — but the rest of the city sits on higher ground in zone 1. Same schools, same council, same job market, same buyers. Compare within it:
| Hull, flood zone | Homes | Median sold price |
|---|---|---|
| Zone 1 (low) | 19,278 | £152,500 |
| Zone 2 (medium) | 1,474 | £110,000 |
| Zone 3 (high) | 9,455 | £112,500 |
There's the effect, with the geography held still: a zone-3 home in Hull sells for a median £112,500 against £152,500 in zone 1 — about 26% less. Restrict it to the last decade of sales and the gap widens to roughly a third: £142,500 in zone 3 versus £210,000 in zone 1. Flood risk isn't priced into a rounding error. It's priced in like a missing bedroom.
And it isn't a Hull quirk. St Albans is a completely different market — five times the money, inland, barely any flood exposure — but among the homes we placed there the direction is identical: a zone-3 median of £185,000 against £249,950 in zone 1, about 26% lower. The sample of high-risk homes there is small (129 sales), so we lean on Hull for the precise figure; but two unrelated markets pointing the same way is exactly what you'd want to see before believing an effect is real.
It's a discount on houses, not on flats
Averages hide things, so we split Hull one level further, by property type — because a flood zone doesn't contain a random mix of homes, and if zone 3 happens to hold more flats, some of the "discount" would just be flats being cheaper. Holding the property type constant too:
| Hull property type | Zone 1 median | Zone 3 median | Gap |
|---|---|---|---|
| Detached | £242,500 | £165,000 | −32% |
| Semi-detached | £152,000 | £115,000 | −24% |
| Terraced | £108,500 | £95,000 | −12% |
| Flat / maisonette | £86,000 | £85,000 | −1% |
The effect survives the control — and it says something you'd never get from a single headline number. Flats barely move: a flat's living space is usually above the ground floor, the freeholder carries the buildings insurance, and the flood risk is somebody else's problem on the deeds. Houses move a lot, and the more house there is to flood — a detached home with a ground floor full of rooms and a garden — the harder it's hit. That is not a statistical artefact. It's the market pricing the actual thing that gets wet.
The single cleanest cut we can offer, holding everything constant — one city, one property type, the last ten years — is the Hull semi-detached: £200,000 on high ground, £145,000 in flood zone 3. A £55,000 gap, 27% of the price, for the same kind of house a few streets away.
What the discount is actually paying for
A number like 27% isn't a penalty the market invented for fun. It's the present value of a run of real, recurring costs that a listing photo can't show you, and it's worth naming them so the figure feels earned rather than spooky:
- Insurance. A zone-3 home costs more to insure, sometimes much more, and even with the Flood Re scheme keeping cover available there are excesses that can run to five figures on a flood claim. That premium recurs every year you own it, and it recurs for the next buyer too, which is why it capitalises into the price.
- The clean-up and the void. A flooded home isn't a quick fix. It's months of drying out, replastering and reflooring — and months you may not be living in it.
- Mortgageability. Lenders and surveyors read the same flood maps we just did. A home that's hard to insure is a home that's harder to lend against, which thins the pool of buyers, which softens the price again.
- The disclosure itself. Flood risk turns up in the local authority searches and the seller's property information form, so every serious buyer eventually learns it. The discount is the market's memory of that conversation, repeated across thousands of sales.
None of that means a flood-zone home is a bad buy. A 27% discount is a discount — if you've priced the insurance, you can live above the ground floor, and you've read the flood history honestly, it can be a rational purchase at a rational price. What's not rational is paying the zone-1 price for a zone-3 house because nobody put the two things on the same map before you exchanged.
The point of all this
Flood zone is one of the clearest cases of the thing this whole site exists to fix: a fact that is on the public record, that materially changes what a home is worth, and that a buyer is structurally unlikely to see until it's expensive to act on it. The seller's agent knows the flood history. The surveyor will find it. The maps have been free the entire time. The only person routinely surprised by it is the buyer.
You don't need 69,671 sales to protect yourself from that — you need one, the one you're about to buy, placed on the same maps we just used. That's what AskHouse does for any UK address: sold prices, flood zone, EPC, planning history and building footprint, joined against a specific home rather than an area average. You can ask about a property directly, see how it's assembled in Explorer, or read how to check flood risk before you buy and what a home is actually worth for the wider method. Flooding is one entry on a longer list — see the full map of the risks worth checking before you buy.
Methodology and limitations
Sources. HM Land Registry Price Paid Data, public address records and the Environment Agency Flood Map for Planning, analysed on 18 July 2026.
The sample. Only confidently matched sales are used: 69,671 in total, spanning sale dates 1995-01-01 to 2026-03-27, across three postcode areas — Hull (HU, 30,207), St Albans (AL, 36,102) and one Kent sector (CT11, 3,362).
Match rate, stated plainly. The sample contains 12.1% of Hull sales (30,207 of 250,511) and 25.8% of St Albans sales (36,102 of 139,741). Older homes and name-only addresses such as "Rose Cottage" are less likely to match and are therefore under-represented. The CT11 slice contains 3,362 matched sales, all in zone 1, so it contributes nothing to the discount finding and is excluded from it.
Flood classification. Each mapped property is assigned the highest planning flood zone covering it; a property outside zone 2 or 3 is treated as zone 1. Zone 3 means at least a 1% annual river-flood probability (0.5% for sea flooding), zone 2 sits between 0.1% and 1%, and zone 1 is below 0.1%.
The reproducible cuts.
- Naive pooled comparison (the mistake): across all 69,671 sales, zone 1 median £204,000 (n=58,262), zone 2 £119,500 (n=1,825), zone 3 £113,000 (n=9,584). We show this only to reject it — it is confounded by region.
- Within Hull (the finding): zone 1 £152,500 (n=19,278), zone 2 £110,000 (n=1,474), zone 3 £112,500 (n=9,455); for sales since 2015, zone 1 £210,000 and zone 3 £142,500.
- Property-type control (Hull, all years): detached £242,500→£165,000, semi £152,000→£115,000, terraced £108,500→£95,000, flat £86,000→£85,000 (zone 1 → zone 3 medians).
- Like-for-like headline: Hull semi-detached sales since 2015 → zone 1 £200,000 (n=3,886), zone 3 £145,000 (n=1,701).
- Cross-market check: St Albans → zone 1 £249,950 (n=35,622), zone 3 £185,000 (n=129).
What this is not. It is a three-area study, not a national one. Medians are unadjusted for sale year within each cut except where a date filter is stated, and property-level confounders we couldn't observe (condition, exact storey, garden size) are not controlled beyond property type. The direction and rough magnitude — a quarter to a third off, concentrated on houses rather than flats — are consistent across two independent markets; treat the precise percentages as estimates from this sample, not a settled national figure.
Ask the House about any property
Get grounded answers on the risks, value, planning, and energy behind any UK home — plain English, no jargon. Free to try.