Are investors buying up cheap homes? Companies now buy nearly a fifth
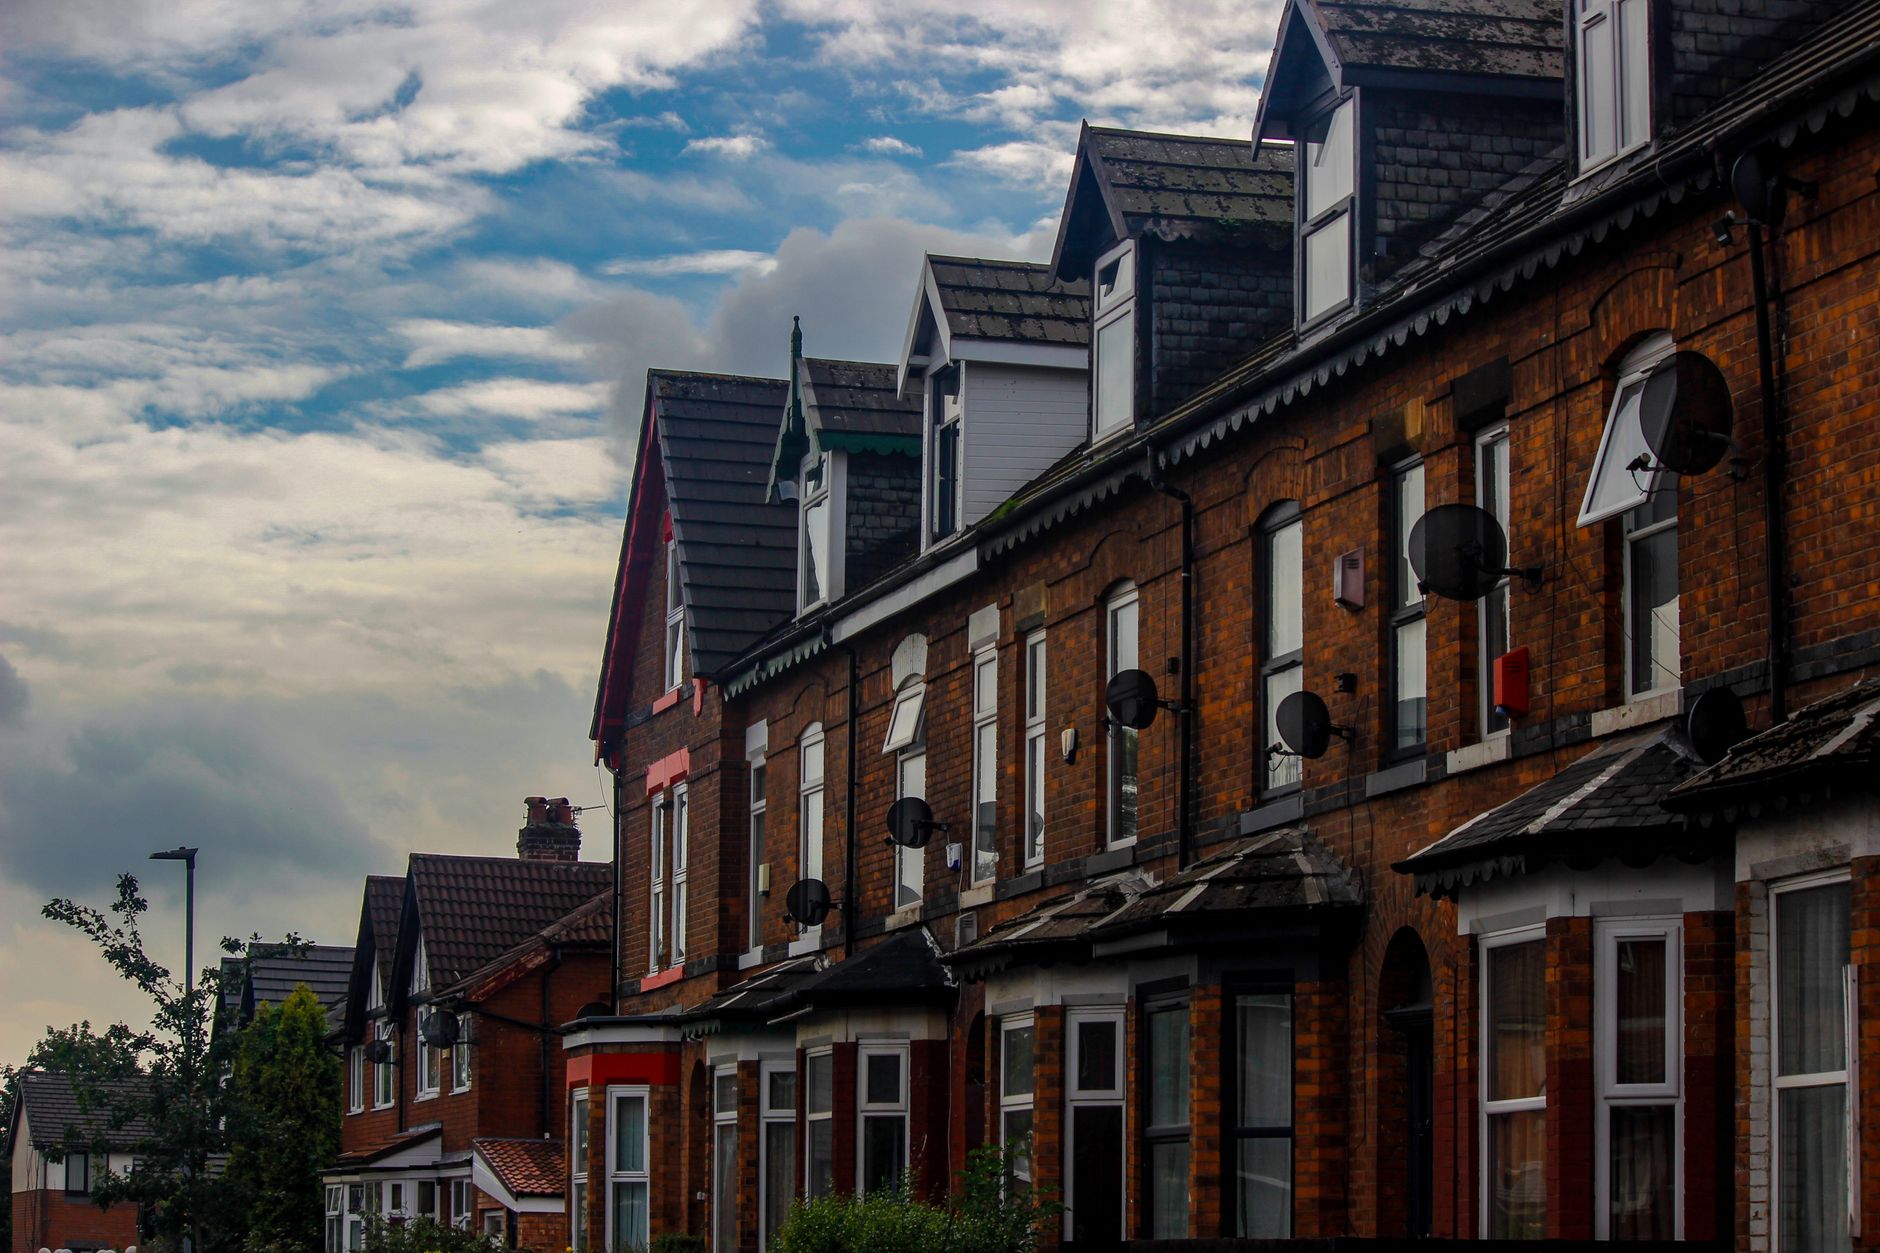
Ask why a starter home is so hard to find and someone will blame investors. They are buying up the cheap end of the market, the story goes, big money outbidding first-time buyers for the terraces they need and dragging whole streets down. The record backs the first part of that story and very little of the rest.
We matched HM Land Registry's list of property owned by UK companies to the sales that put them there. Since the start of 2023, companies that still own the home bought 8.0% of all homes sold in England and Wales, about one in 12. At the cheap end of the market it was 18.8%, nearly one in five. Among the cheapest terraces in Manchester, Middlesbrough and Liverpool, it is more like one in three.
The rest is harder to find. Most of these buyers look small, companies with a handful of houses. Home for home, they paid a little less than other buyers. And streets where companies now own a quarter of the homes have kept pace on price with streets where they own almost none.
From one sale in 200 to one in 12
On the record as it stands, companies bought 0.5% of homes sold in 2014, about one in 200. By 2024 it was 8.4%, about one in 12. Here is how we know.
The Land Registry publishes every title in England and Wales held by a UK company, 4.4 million in the May 2026 edition, with the date each company was registered as owner. It doesn't reliably say what the company paid, or whether the title is a home. The sold-price record says both, but not who bought. So we joined the two by address: a company-owned title that matches a sold home, with the company registered as owner within six months of the sale, marks a company purchase. We counted private companies only. Councils and housing associations, which buy many new homes for affordable rent, are left out.
| Year | Share of all sales | Share at the cheap end |
|---|---|---|
| 2014 | 0.5% | 1.2% |
| 2016 | 1.7% | 3.4% |
| 2018 | 3.2% | 7.0% |
| 2020 | 4.3% | 11.2% |
| 2022 | 6.3% | 15.2% |
| 2024 | 8.4% | 19.3% |
| 2025 | 8.0% | 19.3% |
That climb is steeper than the truth. The list only shows companies that still own the home, so the further back you look, the more buyers have since sold and dropped out of it. Even if half the companies that bought in 2014 had sold since, the real share that year would have been about 1%, an eighth of 2024's. The count also misses homes that passed into a company without a sale on the record. And the record only began to include most sales to companies in late 2013, so the table starts in 2014.
The rise fits a change in tax. Announced in 2015 and phased in over four years from April 2017, it took much of the tax relief on mortgage interest away from higher-rate landlords who own in their own name. Companies kept full relief, because for them interest is a business cost. That relief became worth far more once mortgage rates rose in 2022. The company share kept climbing steeply through 2022 and 2023, partly because other buyers fell away faster: in 2023 sales fell by a fifth, and company purchases by only about 4%.
It also means some of this is not new demand. A landlord who would once have bought in their own name may now buy through a company instead, or move a house they already own into their own company, for a price, which the record shows as a sale. Landlords who own personally don't show up in the company list, so we can't say how much of the rise is new money and how much is a new wrapper. When we looked at why flats lose value more often than houses, the stamp duty surcharge and this same loss of mortgage relief were two reasons to expect fewer landlords bidding. More of the ones still bidding now do it through a company.
Nearly one in five at the cheap end
To find the cheap end fairly, we ranked each sale by the typical price of that type of home in its postcode sector that year, not by what the buyer paid, since companies tend to pay less, and ranking by price paid would flatter their share. Here is the company share in each tenth, for sales from 2023 to 2025.
| Typical price of the home's type and area | Bought by a company |
|---|---|
| Cheapest tenth (up to about £140,000) | 18.8% |
| Second | 10.9% |
| Third | 9.1% |
| Fourth | 7.4% |
| Fifth | 6.9% |
| Sixth | 6.1% |
| Seventh | 5.1% |
| Eighth | 5.2% |
| Ninth | 5.1% |
| Dearest tenth | 4.9% |
The share falls fast through the cheaper half of the market, then settles at around 5%. Nearly two in three homes at the cheap end are terraced houses, and terraces are the biggest part of what companies buy: 44.6% of company purchases, against 27.6% of everyone else's. Companies bought 12.4% of all second-hand terraced houses sold, against 3.2% of detached ones, and 21.7% of terraces at the cheap end. Flats come next: companies bought 10.0% of second-hand flats and 21.2% of new-build ones.
In some places it goes much further. Taking terraces in the cheapest fifth of the market, to have enough sales per district, companies bought 38.9% of those sold in Manchester, 35.2% in Middlesbrough, 32.3% in Darlington and 31.8% in Liverpool. In one Middlesbrough postcode sector, almost entirely terraced, with a median sale price of £65,000, there were 674 sales between 2023 and 2025. Companies made 364 of them.
Where companies buy most
The North East and North West led, with companies buying 11.7% and 10.5% of homes sold, against 5.9% in the South East and 5.0% in the South West. London came third, at 10.2%. At the cheap end, the northern and Midland regions ran from about 18% to 20%.
| District (at least 3,000 sales, 2023 to 2025) | Bought by a company |
|---|---|
| Liverpool | 21.1% |
| Middlesbrough | 19.9% |
| Slough | 18.6% |
| Nottingham | 18.2% |
| Kingston upon Hull | 18.1% |
| Powys | 2.6% |
| Horsham | 2.6% |
| Malvern Hills | 2.4% |
| Hart | 2.3% |
| Rochford | 2.2% |
Of the 305 districts with at least 3,000 sales, 70 saw companies buy one home in ten or more. Slough is the one southern name in the top five, and outer London isn't far behind: Harrow at 17.4%, Brent 16.7%, Enfield 16.2%, Ealing 15.7% and Barking and Dagenham 15.5%.
Mostly a handful of houses each
Of the company purchases since 2023, 65.7% were by companies with five or fewer homes we could find on the record, and 8.2% by companies with more than a hundred. About 65% were registered to let property they own, and about one in six to buy and sell it. A third of purchases were made by a company less than a year old.
That Middlesbrough sector shows it in miniature. Its 364 company purchases were made by 255 different companies, and no single one made more than 15.
So the picture of a faceless fund buying up whole streets finds little support here, with one caveat: a landlord who holds each house in a separate company looks small in this data, because the record can't link sister companies. For the most part, this looks like the small landlord, with a company in between.
They pay less, mostly for less
Here is the number that makes company buyers sound like bargain hunters. For the same type of home, with the same tenure, in the same postcode sector and the same year, companies paid 13.2% less than other buyers.
That comparison sets their purchases against everyone else's, and within any area companies buy the cheaper homes: the smaller ones, the plainer ones, the ones that need work. To take that out, we followed the same homes, as we did for new builds at first resale. Where a company bought a home that had sold before, we compared its growth in price since that sale with homes of the same type in the same district, bought and resold in the same years, where the buyer at resale wasn't a company. Measured that way, companies paid 4.0% less than the home's own history implies. The two figures aren't measured the same way, so the first doesn't split neatly into the second, but the direction is clear: most of the gap is which homes they buy.
The same-home gap was 1.3% where the previous sale was within five years, and 6.3% where it was sixteen years or more. Both sides of that comparison had gone equally long without a sale, so age alone doesn't explain it. Among long-held homes, the ones companies bought may have been the least modernised, the house that never had the new kitchen or the rewire its neighbours had. Quick sales, and landlords moving a house into their own company at a cautious valuation, could also play a part. The record can't separate them.
What the record can't tell us is whether all this buying has pushed up prices at the cheap end for everyone. A comparison between buyers in the same place and year cancels that out by design. What it does show is no sign of companies paying more than other buyers for the same home.
Company-heavy streets have kept pace
Those purchases add up. Of the 16 million homes that have sold at least once since 1995, at least 4.6% now belong to a private company: 7.6% of flats, 6.9% of terraced houses and 1.9% of detached houses. In Liverpool it is 12.4%. Of the 623,740 postcodes, usually a street or part of one, with at least ten homes on the record, companies own a quarter or more in 19,544 and half or more in 3,084.
A street full of landlords sounds like a street in decline. We checked, using homes resold between 2023 and 2025 to buyers other than companies. On the raw numbers, homes in postcodes where companies own a quarter or more grew by 37.9% since their previous sale, against 45.1% where they own under 5%. But those postcodes are cheaper, more terraced and in different places. Compare each home only with others of the same type, in the same district, bought and sold in the same years, and the gap all but disappears: 0.7% behind, terraces included.
That test has a weakness. We know who owns the homes today, and much of the growth it measures came before most of the company buying. So we ran it again on homes bought in 2016 or later, after company buying took off. There, homes in postcodes where companies own a quarter or more grew slightly more than comparable homes where they own under 5%: 0.5% more, and terraces 1.5% more. Neither version can separate cause from choice: if companies pick streets they expect to rise, that could hide a drag. And these are typical figures, no promise about any one street. On this evidence, a street with a lot of company owners tells you something about who lives there, and little about whether the house will fall behind.
If you're buying or selling at the cheap end
If you are buying at the cheap end, especially a terrace in the North or the Midlands, expect a company to be looking at the same houses. If one does beat you to a house, the record gives no sign it was by paying more. Being ready is the part you can match: have your mortgage agreed in principle and a solicitor ready before you offer.
Where companies own a third of the homes on a street, much of that third is probably let, and more of the street besides, since landlords who own in their own name don't show on the list. The Land Registry's list of company-owned titles is free to download once you register, so you can check a postcode yourself. That is a question about how you want to live. The price record doesn't make it a financial one.
If you are selling a home that hasn't changed hands in many years, companies that bought homes like it paid about 6% less than the market's growth implied. Whether that was the state of the houses, the terms of the sale or something else, the record can't say. Before you accept any offer, from a company or anyone else, check what similar homes nearby have resold for.
AskHouse reads the sold-price record for one address at a time: what this home and the others on its street sold for, and when they last changed hands. You can ask about a specific property or look it up in Explorer. If the cheap home in front of you is a flat or a new build, how often flats sell at a loss and what buying new costs at resale are worth reading alongside this.
Landlords have always bid on cheap terraces. Now, on nearly one sale in five at the cheap end, the one that wins has a company number, usually a handful of houses, and no sign of having paid more than you would.
Methodology and limitations
Sources. HM Land Registry Price Paid Data for England and Wales, 31,299,627 registered sales dated 1 January 1995 to 31 March 2026, and HM Land Registry's dataset of UK companies that own property in England and Wales (May 2026 edition, 4,413,353 titles), with company details from Companies House. Regions come from the ONS postcode directory. Analysed on 26 September 2026.
Finding company purchases. Sales were prepared as in our flats study: detached, semi-detached and terraced houses and flats priced between £10,000 and £10 million, one entry per address per day, standard and additional entries alike. We matched each company-owned title to a sold home in the same postcode whose address (flat number, house number or building name, and street, ignoring punctuation and the words "flat" and "apartment") begins the title's address. Where a company owns the freehold above a leasehold home, we ignored it: the company owns the building, not the home. A sale counts as a company purchase when the company was registered as owner between 30 days before and 180 days after the sale; the typical gap is a little over two weeks. Where a title matched more than one sale in that window, we kept the closest. Private companies are those the Land Registry lists as limited companies, PLCs, limited liability partnerships or unlimited companies. Councils, housing associations and other registered societies are excluded throughout. "Since 2023" means sales from 1 January 2023 to 31 December 2025.
The cheap end. Each sale is ranked by the median price of all sales of the same property type in the same postcode sector and year (groups of at least five sales), and split into tenths within each year. The cheapest tenth topped out at £130,000 (2023), £137,500 (2024) and £141,000 (2025). Ranking by each sale's own price instead gives a higher cheapest-tenth share, 21.8%, partly because companies pay less.
The cuts behind the figures.
- Headline: 198,734 of 2,485,567 sales, 8.0% (one in 12.5). Cheap end: 18.8%.
- By year, all sales / cheap end: 2014 0.54% / 1.2%; 2015 0.97% / 1.9%; 2016 1.73% / 3.4%; 2017 2.47% / 5.1%; 2018 3.16% / 7.0%; 2019 3.92% / 9.0%; 2020 4.30% / 11.2%; 2021 4.86% / 12.0%; 2022 6.25% / 15.2%; 2023 7.54% / 17.7%; 2024 8.42% / 19.3%; 2025 7.99% / 19.3%. Company purchases 2022 63,249, 2023 60,705, 2024 73,223, out of 1,012,125, 804,901 and 869,520 sales.
- By type, second-hand / new build: detached 3.2% / 2.2%; semi-detached 5.5% / 6.6%; terraced 12.4% / 8.8%; flats 10.0% / 21.2%. Cheap end: terraced 21.7%, flats 13.9%, semi-detached 12.7%; the cheapest tenth is 64.1% terraced (157,259 of 245,366 sales). Terraces in the cheapest fifth of the market: 18.6% nationally; by district (at least 1,000 such sales) Manchester 38.9% (n=2,060), Middlesbrough 35.2%, Darlington 32.3%, Liverpool 31.8%. Median price of company purchases £190,000, other buyers £285,000.
- Regions, all sales / cheap end: North East 11.7% / 20.4%; North West 10.5% / 20.4%; London 10.2% / too few; Yorkshire and the Humber 8.8% / 19.1%; East Midlands 8.3% / 18.7%; West Midlands 8.3% / 17.7%; Wales 6.4% / 14.4%; East of England 6.4% / 14.8%; South East 5.9% / 14.7%; South West 5.0% / 9.5%.
- Districts: 305 with at least 3,000 sales; 70 at 10% or more, 12 under 3%. London's highest: Harrow 17.4%, Brent 16.7%, Enfield 16.2%, Ealing 15.7%, Barking and Dagenham 15.5%. The Middlesbrough postcode sector: 674 sales, 364 company purchases by 255 companies (most by one company: 15), median price £65,000, 98.8% terraced. We have not named it.
- The buyers: by homes the company owns that we could match to a sold address, 1 home 30.0% of purchases, 2 to 5 35.7%, 6 to 20 18.6%, 21 to 100 7.5%, over 100 8.2%. Company age at purchase: under a year 33.3%, one to three years 21.3%, older 44.4%, unknown 1.0%. Registered activity: letting own property 64.5%, buying and selling own property 16.2%, construction (SIC 41) 4.5%, other or unknown about 15%.
- Price, same area: second-hand sales, groups of postcode sector, type, tenure and year with at least three company and three other purchases; difference in median log price, weighted by company purchases: -13.2% (132,051 company purchases in 19,823 groups). Detached -9.8%, semi-detached -16.2%, terraced -13.4%, flats -11.0%.
- Price, same home: company purchases that were the second sale in a repeat-sale pair built as in the flats study; the median growth since the previous sale of company purchases against the median growth of non-company resales in the same district, type, purchase year and resale year (at least three of each), weighted by company purchases: -4.0% (n=68,874). Previous sale up to 5 years before -1.3%, 6 to 15 years -3.1%, 16 or more -6.3%.
- Ownership today: 741,224 of 16,038,498 addresses that have sold since 1995 (4.6%, a floor, since unmatched titles drop out); flats 7.6%, terraced 6.9%, semi-detached 3.0%, detached 1.9%; Liverpool 12.4%. Postcodes with at least ten such addresses: 623,740; companies own 25% or more in 19,544 and 50% or more in 3,084.
- Company-heavy postcodes: resales of second-hand homes 2023 to 2025 to buyers other than companies, grouped by the share of the postcode companies own today. Each home's growth since its previous sale is compared with the median growth of homes in postcodes under 5% in the same district, type, purchase year and resale year (at least five such homes); the figure is the median of those differences, so the under-5% group scores 0.0% against itself. 5 to 10% 0.0%, 10 to 25% +0.1%, 25% or more -0.7% (n=15,480); terraced 0.0%, 0.0%, -0.7%. Homes previously bought in 2016 or later only: +0.2%, +0.6%, +0.5% (n=8,379); terraced +0.2%, +1.0%, +1.5%. Raw median growth: under 5% 45.1%, 25% or more 37.9%.
Limitations, stated plainly.
- Survivors only. The ownership list shows who owns a title now. Companies that bought and later sold, or moved the home to another company, are missing, which understates the earlier years most.
- Not every company purchase is visible. Homes moved into a company without a registered price, and titles whose address was written too differently in the two records, are missed. Of the private company titles registered in 2023 to 2025 that match a sold home, 78% matched a sale in the window. A landlord who moves a home they already own into their own company, with a price registered, counts here as a company purchase though the home never came to market.
- Sales to companies were only routinely included in the sold-price record from October 2013. The latest months may still gain a little as registrations are completed. A symmetrical 90-day window instead of ours gives 7.8% for 2023 to 2025.
- Company size counts only homes we could match, and sister companies can't be linked, so large landlords split across many companies look small.
- The record shows neither condition nor how a purchase was funded, so the same-home discount can't be split between the state of the house and the terms of the sale.
- Company ownership is measured today, after the sales we compare. England and Wales only.
- This study describes who buys and at what price, not why. The tax explanation fits the timing; it is not tested company by company.
Every figure can be reproduced from the public Price Paid and company ownership datasets using the rules above.
Ask the House about any property
Get grounded answers on the risks, value, planning, and energy behind any UK home — plain English, no jargon. Free to try.