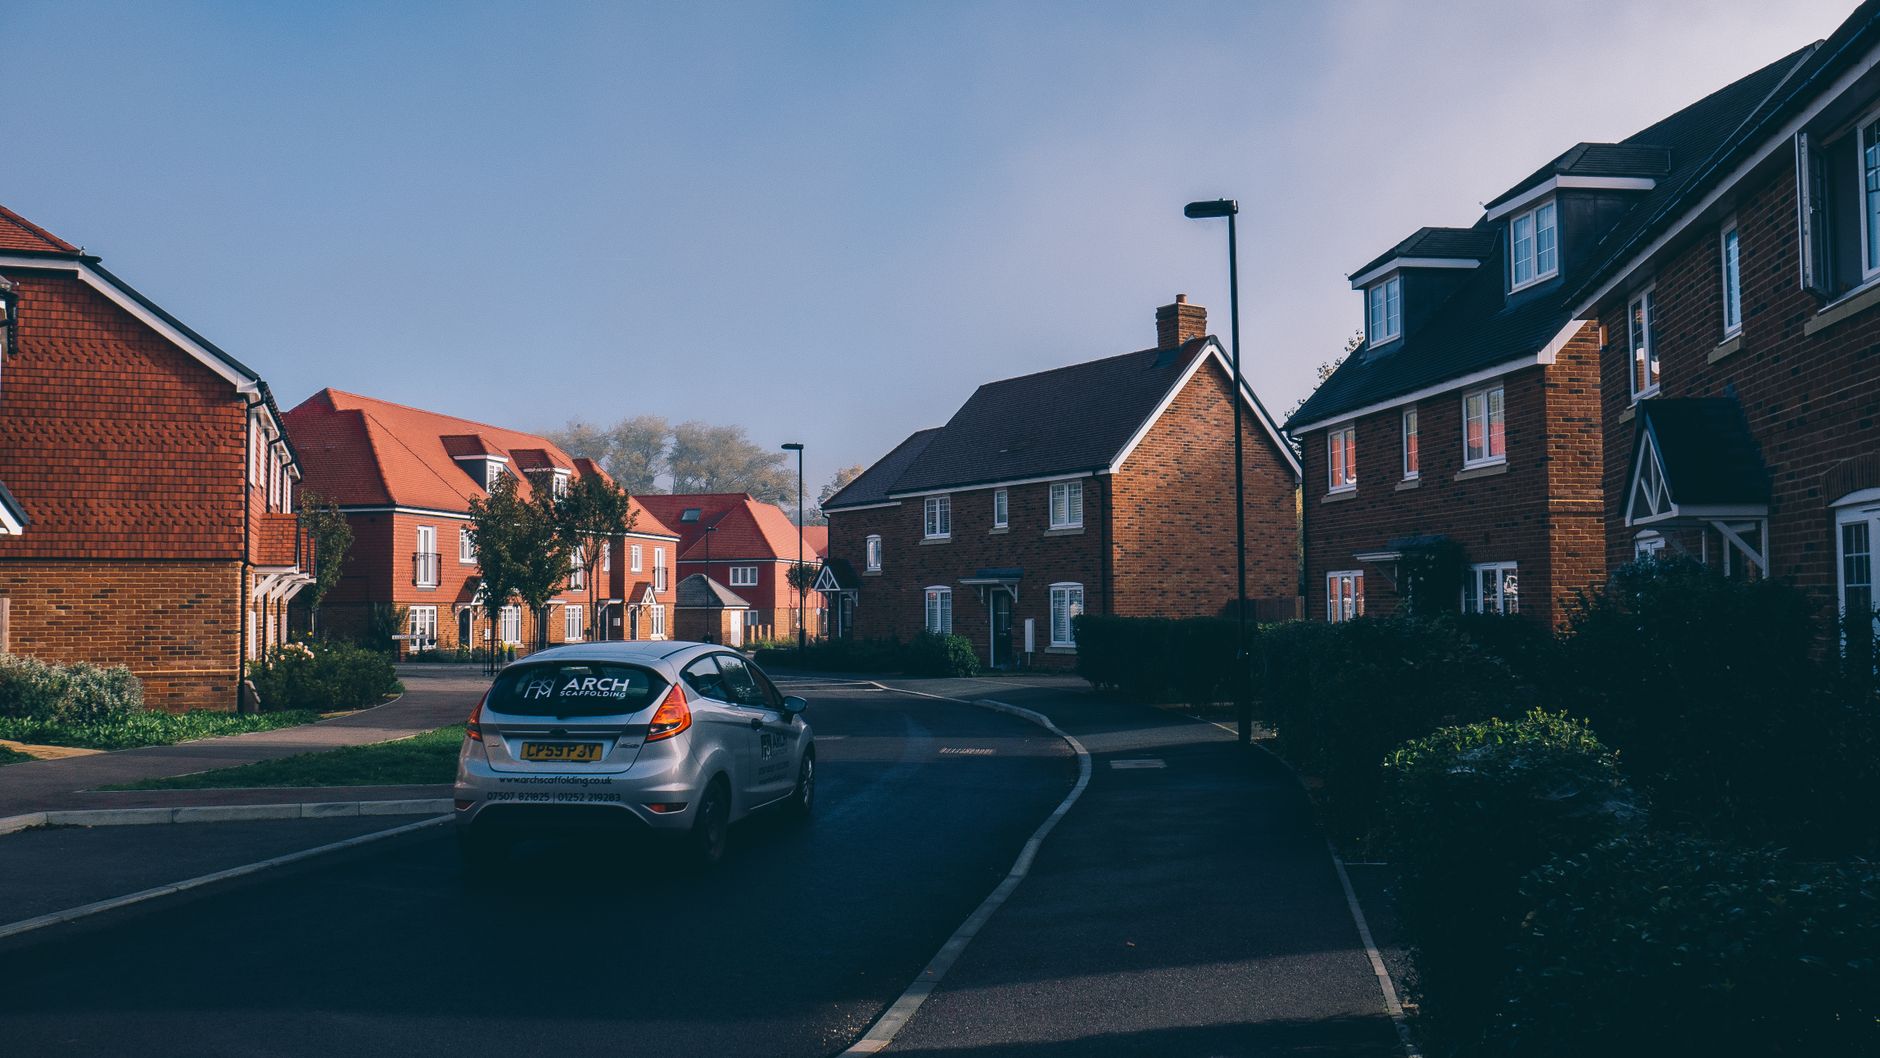
Do new builds lose value? Three in four fall behind
Everyone has heard that you pay 20% extra for a new build and lose it the day you move in. Ask someone who has actually sold one, though, and they will usually tell you they made money. Since the start of 2024, only 5.4% of houses first bought new have resold for less than the owner paid, barely more than the 4.1% of second-hand houses.
Both are half right. The owners did make money, and the old line is right that buying new costs you, but it costs nearer 8% than 20%, and it goes over years, not on moving day. We followed new builds in HM Land Registry's record to their first resale and set each one against second-hand homes of the same type, in the same district, bought and sold in the same years. Like-for-like, the new builds resold for 8.3% less than they would have fetched had they grown like the second-hand homes around them. Three in four fell behind, where chance alone would put half.
For a typical new-build house resold since 2024, bought for about £265,000, the shortfall comes to about £23,000.
The question we left open
When we compared new builds with 1930s semis, we measured the new-build premium at the till: under 5% for a semi, about 14% for a terrace and 48% for a flat. A till premium sets a new semi against every second-hand semi in the country, from ex-council to Edwardian, so it won't match what follows. What follows sets each new home against neighbours of the same type bought and sold in the same years, which gets far closer to what buying new cost. We also said the other half of the old line, that the premium vanishes on resale, needed the same house followed from one sale to the next, and that the record didn't reliably support it.
Matched address by address, it does. In our study of flats and houses we linked each sale in the record's 31.3 million to the same home's next sale. Among those pairs are 1,451,924 homes first sold new between 1996 and 2023 and later resold. We compared each one only with second-hand homes that shared its district, its property type, its purchase year and its resale year. A new semi in Rotherham bought in 2015 and sold in 2021 is measured against second-hand semis in Rotherham bought in 2015 and sold in 2021, and nothing else. 890,471 new builds, about three in five, had enough of those neighbours to compare.
That design matters because new builds cluster in particular districts and particular years, and a plain average of new against old would mostly measure where and when they went up. Matching on place and timing leaves the choice a buyer actually faces: new or second-hand, same area, same moment.
Every type fell behind. New semis and terraces, the staple of the modern estate, did worst, trailing by 9.1% and 9.6%, with four in five of them behind their second-hand equivalents. New flats trailed by 8.9% and new detached houses by 6.8%.
A profit that still fell short
One new development near Derby, mostly semis with a few terraced and detached houses, is an unusually clear case. Forty-two of its houses, bought new in 2016 and 2017 for a median of £188,000, have since been resold. Three went for less than their owners paid. The typical owner came away £25,000 up.
Second-hand houses of the same types in the same district, bought and sold in the same years, typically grew by 29.0%. The houses on this estate grew by 11.9%. Set house by house against its own comparison, rather than median against median, the typical one finished about 10% short of where keeping pace would have put it. Forty of the forty-two fell behind. Hardly anyone there lost money in the way people count it, and nearly everyone lost ground.
The gap here is bigger than most, but the shape is the norm, and it is why the cost of buying new so rarely registers: it turns up as a smaller gain than you would otherwise have had, and nobody sends you a statement for the difference.
Six years, then it stops
For houses, the gap depends on how long the first owner stayed, and for as long as we can compare, it follows the same curve whichever decade they bought in.
| Years between sales | Bought 1996 to 2007 | Bought 2013 to 2022 |
|---|---|---|
| Up to 1 | -4.2% | -5.7% |
| 2 to 3 | -6.7% | -6.5% |
| 4 to 5 | -8.9% | -8.0% |
| 6 to 10 | -9.6% | -9.6% |
| 11 to 15 | -8.2% | too few to tell |
| 16 or more | -8.8% | too soon to tell |
Sell within a year or so and you trail by about 5%. By six years the gap is close to 10%. In houses bought before 2008, the only ones old enough to show what happens next, there it stays: houses held for sixteen years or more trail by 8.8%, no worse than houses held for six. If buyers pay extra for a house being new, this is how you would expect it to look: the extra wears off as the house ages into an ordinary second-hand one, over about six years, and the lost ground is not made back.
That takes care of the obvious suspect. Help to Buy, the government equity loan for buyers of new-build homes in England, ran from 2013 until 2023, and critics said it propped up new-build prices. But the gap was there from 1996, long before the scheme began, and houses bought during it trail by much the same amount, at much the same pace. The record doesn't say which sales used the scheme, so we can't rule out a cost to those buyers in particular. What it does show is that Help to Buy didn't create this gap, and there is no sign that it widened it across the market.
Flats tell a different story, and it is mostly about when they were bought. New-build flats from 1996 to 2001 trail second-hand flats by 13.0%. Those bought between 2014 and 2018 trail by just 1.7%, and the change holds at the same holding periods, so it isn't just that recent owners sold sooner. Recent new flats have come much closer to keeping pace with second-hand flats, which only means they now share their troubles. As we found when we followed flats against houses, flats of every age have struggled: one flat resale in five since 2024 came in below the previous price, and for flats first bought new it was 34.1%, a figure not matched on place and timing like the gaps here. With a flat, the bigger question is the flat itself, new or not.
It isn't one region
The gap shows in every English region and in Wales, from 6.8% in the South West to 9.6% in the North West, with London at 9.3%. Of the 329 districts with at least 500 new builds to compare, 328 show a gap. The exception is Powys, where 662 new builds did slightly better than second-hand homes. At the other end, the widest gaps were in Nottingham (15.5%), Enfield and Thurrock (both 14.4%).
Leasehold new-build houses fared worse. Those sold on a lease, the arrangement behind the ground-rent scandal of the 2010s, trailed their second-hand neighbours by 10.6%, against 7.0% for freehold new-build houses, on a home-by-home measure explained in the methodology.
Not all of it is about being new
We tried to break the finding. It held, but it gave some ground.
Where estates go up matters. A district is a big place, and a new estate on its edge may simply sit in a slower part of it. Narrow the comparison to the same postcode sector, a few thousand homes, and for the tenth of the compared new builds with enough neighbours that close, the gap is 6.4%. That is a different mix of homes, so read it as smaller rather than as a precise correction. It is still there.
Older homes also get improved between sales, with a new kitchen, a loft conversion or an extension, and all of it shows up in the next price. A young house has less to improve. To test it, we looked at people who bought a nearly new home from its first owner, within five years of the first sale. They lagged the rest of the second-hand market too, by 5.8%, against 8.8% for first owners in the same comparison.
So being first isn't the whole story. The record can't separate two reasons the second owners lagged: some of the gap may belong to the house and its estate, whoever owns it, and some may be a newness premium that the second owner also paid a share of. What it does show is that the first owner trails by about three points more than the next one. For a buyer choosing today, the split matters less than it sounds, because the choice in front of you is the one in our headline: a new house against a second-hand one down the road.
Something else the record can't see: developers often sweeten a sale with paid stamp duty, deposit contributions or free extras, and the registered price is usually the figure before those incentives. A house bought for £300,000 with £15,000 of incentives was really a £285,000 purchase, and some of the gap may simply be the resale market declining to pay for the sweeteners. We can't say how much.
Price the newness as a cost
A new build still costs less to heat, as we found comparing new builds with 1930s semis, and a first decade without a roof or rewiring bill is worth having. That value is in living there. It rarely comes back when you sell.
For a house, expect to trail a comparable second-hand house by around 9% once the newness has worn off, most of it within five or six years. On a house that would otherwise sell for £300,000, 9% is £27,000. Staying longer doesn't win it back, though after about six years the gap stops growing. For a flat, weigh the flat market before the new-versus-old question.
Before you buy, look up what houses on the same development, or on the developer's earlier phases and nearby estates, have resold for. First resales are the best guide to what a new house will be worth once it is second-hand. Ask the developer what incentives are in the price, and negotiate on the price itself. Prefer freehold. And compare the asking price with second-hand homes of the same type nearby, not with the show home.
AskHouse checks the sold-price record for a specific address rather than an area average. You can ask about any property or look through the evidence in Explorer. The postcode average is a lie explains why an area average misleads, and if the house comes with a lease, the 25-year cost of a leasehold is worth reading first.
Ask a first owner whether they lost money and they will tell you no. Ask what the older houses down the road sold for, and you will find out what the new one cost them.
Methodology and limitations
Source. HM Land Registry Price Paid Data for England and Wales: 31,299,627 registered sales dated 1 January 1995 to 31 March 2026, analysed on 26 September 2026. Regions come from the ONS postcode directory.
Building the pairs. As in our flats study, we kept sales of detached, semi-detached and terraced houses and flats priced between £10,000 and £10 million, and kept one entry where an address had more than one on the same day. Each sale was matched to the next sale of the same address (postcode, house number or name, flat number and street). A pair counts only if the property type is the same at both sales, the sales are at least six months apart, the second sale is not flagged as a new build, and the second price is between a fifth and ten times the first. That gives 13,608,200 pairs. This study uses the 13,020,297 where the first sale was between 1996 and 2023. A home counts as "first bought new" when the first sale in its pair carries the Land Registry new-build flag: 1,451,924 pairs.
The comparison. Each pair was placed in a cell defined by district (as recorded on the sale), property type, purchase year and resale year. A cell counts only if it holds at least five new-build and five second-hand pairs. Within a cell, the gap is the difference between the median growth of the new builds and the median growth of the second-hand homes, measured on a log scale. Cells are averaged, weighted by their number of new builds, and the result converted back to a percentage: -8.3% means the new builds resold for 8.3% less than second-hand growth in the same cells implies. 890,471 new builds (61% of the total) fall in a qualifying cell. A new build "fell behind" if it grew less than the second-hand median in its cell.
The cuts behind the figures.
- Headline: -8.3% (n=890,471). Detached -6.8%, semi-detached -9.1%, terraced -9.6%, flats -8.9%. Fell behind: 74.6% overall; detached 72.9%, semi-detached 81.5%, terraced 80.4%, flats 70.8%. Leaving out the provisional 2026 resales changes nothing: -8.3% (n=890,081).
- Houses by years between sales, bought 1996 to 2007 / bought 2013 to 2022: up to 1 -4.2% / -5.7%; 2 to 3 -6.7% / -6.5%; 4 to 5 -8.9% / -8.0%; 6 to 10 -9.6% / -9.6% (n=89,822 / 43,342); 11 to 15 -8.2% / -11.0% on only 1,074 homes bought in 2013 and 2014, too few to read; 16 or more -8.8% / none. Years between sales are the difference in calendar years. By single purchase year, 1996 to 2020, houses range from -10.4% to -5.1%.
- Flats by purchase years: 1996 to 2001 -13.0% (n=63,203); 2002 to 2007 -11.1%; 2008 to 2013 -5.2%; 2014 to 2018 -1.7% (n=42,947); 2019 to 2023 -2.4%. Held four to seven years: bought 1996 to 2007 -13.1%, bought 2013 to 2022 -4.4%.
- Regions (each district assigned to the region most of its paired sales fall in): North East -9.3%, North West -9.6%, Yorkshire and the Humber -9.1%, East Midlands -8.4%, West Midlands -9.1%, East of England -7.5%, London -9.3%, South East -7.3%, South West -6.8%, Wales -7.7%.
- Districts: 329 districts have at least 500 new builds in qualifying cells; 328 show a negative gap. Median -7.8%; range from -15.5% (City of Nottingham) to +2.9% (Powys, n=662). Enfield and Thurrock -14.4%. The record uses the district name in force at each sale, so some pre-2009 councils appear alongside their successors.
- Tenure, houses: each new build measured against its own cell's second-hand median, then averaged. Leasehold new-build houses -10.6% (n=38,039), freehold -7.0% (n=546,253).
- Resales since 2024: gap -7.8% (n=67,413); houses -7.3%, flats -8.6%. The shortfall is what each new build would have fetched at its cell's second-hand median growth, minus what it did fetch. Median shortfall: houses £23,375 (median purchase price £264,778), flats £20,852. Sold for less than the purchase price (all resales since 2024, any purchase year): new-build houses 5.4% (n=97,328), second-hand houses 4.1% (n=893,041); new-build flats 34.1% (n=42,233), second-hand flats 16.6% (n=188,160).
- Postcode sector instead of district: -6.4% (n=88,093).
- Second owners: homes whose previous sale was a new-build sale less than five years earlier, compared with all other second-hand homes in the same cells: -5.8% (n=98,418), against -8.8% for first owners in the same comparison (n=884,765).
- The development near Derby: 42 new-build houses (33 semi-detached, 5 terraced, 4 detached), all in one postcode, first sold in 2016 and 2017 and resold between 2017 and 2025. Median purchase price £188,000, median resale price £224,000, median gain £25,000, median growth 11.9%, against 29.0% typical growth for second-hand houses of the same type in the same district and years (each house's own cell median). Measured home by home, -10.3%. 40 grew less; 3 sold at a loss. We have not named it.
Limitations, stated plainly.
- Figures are nominal. We have not adjusted for inflation, stamp duty, fees or moving costs.
- Matching on address is imperfect. A new build whose address was entered differently at its two sales drops out.
- 39% of new builds sit in cells too thin to compare and are left out.
- The record does not show improvements, so a second-hand home extended between sales counts as the same home. The second-owner test suggests that improvements and estate effects could explain a substantial part of the gap.
- The registered price does not net off developer incentives, and the record does not identify Help to Buy purchases. The era comparison is by purchase date only.
- The record we analysed does not separate standard sales from the Land Registry's "additional price paid" entries, such as repossessions and some sales to companies.
- England and Wales only. Scotland and Northern Ireland keep separate registers.
- This study measures outcomes, not causes. The explanations above are tested where the record allows and flagged where it does not.
Every figure can be reproduced from the public Price Paid dataset using the rules above.
Ask the House about any property
Get grounded answers on the risks, value, planning, and energy behind any UK home — plain English, no jargon. Free to try.