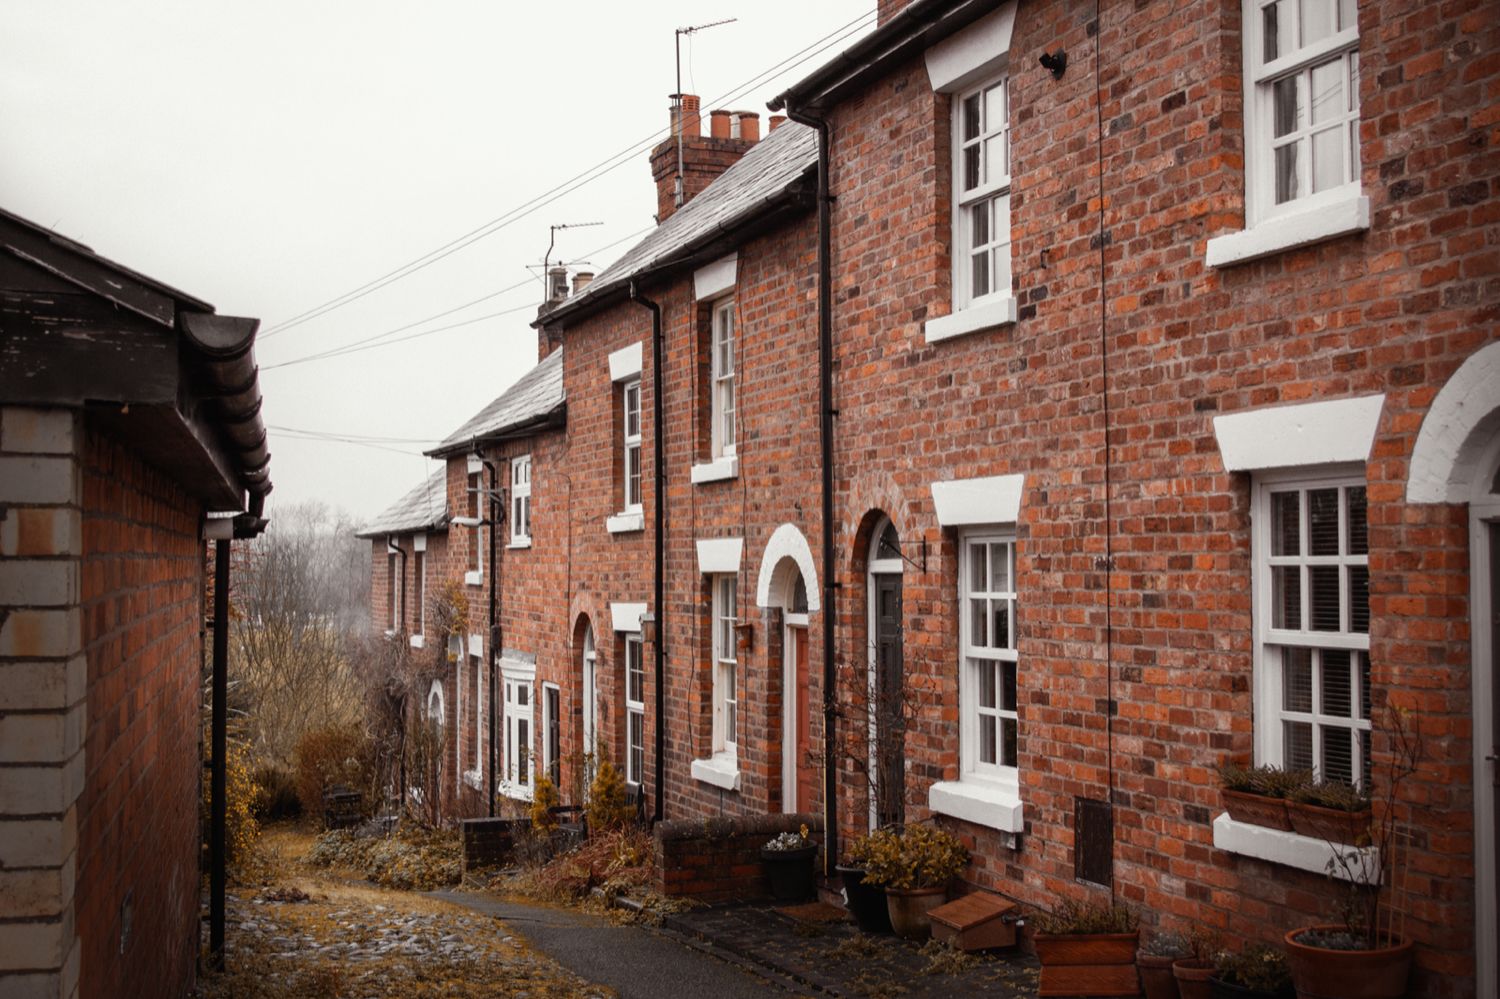
One house, six ways: everything the listing didn't tell you
A property listing is a sales document that has learned to sound like a description. Four rooms, a garden, "scope to modernise", a price. Forty words and a wide-angle lens, and none of it is untrue — it is just the two per cent of the house that helps it sell, with the other ninety-eight left off the page.
We wanted to see what the other ninety-eight look like. So we picked one real house, pulled everything the public record holds about it, and read it back the way a surveyor, a conveyancer, a planning officer and a valuer would if you could get all four in a room. One address, six questions, no guesses.
The house is a semi-detached Victorian home in Ramsgate, in the CT11 postcode district. We are not going to name the street or the number — the whole point is that this is an ordinary house, and everything you are about to read is on the public record for millions of ordinary houses like it. Think of it as the first of a series: House of the Month, an anonymous home walked through all six of the answer categories we organise everything around — risks, value, building, planning, area and energy.
Here is what the listing didn't tell you.
1. The price: a thirty-year receipt
Every sold price for this house since the Land Registry started publishing them is a matter of public record, and read in order they tell a story no single asking price ever could.
| Sold | Price | What it was |
|---|---|---|
| Jul 1996 | £50,000 | Freehold, semi |
| Apr 2003 | £77,500 | +55% over 7 years |
| Jan 2006 | £186,000 | The boom |
| Jan 2007 | £235,000 | The top |
| Jul 2022 | £375,000 | +60%, but it took 15 years |
| Feb 2026 | £425,000 | The latest sale |
Six transactions across thirty years, and the shape is the whole point. From £50,000 to £425,000 is an 8.5-fold increase — roughly 7.5% a year compounded, comfortably ahead of wages and inflation over the same window. But nobody experienced it as a smooth 7.5%. Whoever bought at the January 2007 peak paid £235,000 and then watched the financial crisis land on the market weeks later. It took until 2022 — fifteen years — for the house to change hands again, at £375,000. A 60% gain that reads like a triumph and felt, for anyone who needed to sell in between, like a trap.
That is the first thing a headline price hides: not the number, but the timing risk buried inside it. The most recent sale, £425,000 in February 2026, is up 13% on 2022 — steady, unremarkable, exactly the sort of move that gets averaged into a regional statistic and forgotten.
Now put it in context. Across the CT11 9 sector, semi-detached houses that sold since the start of 2024 have a median price of £350,000 (41 sales). Detached houses in the same sector sit at a median of £425,000 (11 sales). Our semi sold at the detached median — 21% above what a typical local semi fetches. The public record can't tell you why in a single field, but the rest of this piece can: it is large for its type, it sits inside a conservation area, and its energy record has quietly improved. That is what "worth £425,000" actually decomposes into — and it is the argument we make at length in what a home is actually worth. A portal estimate would have given you the number. It would not have given you the receipt.
2. The energy label that changed its mind
There is an EPC — an Energy Performance Certificate — attached to this house, and here is the detail that should make you distrust every band you have ever seen quoted as a fact: the house has been assessed twice, and the two certificates disagree.
- July 2021: band E, efficiency score 45 out of 100, estimated 9.2 tonnes of CO₂ a year.
- October 2024: band D, efficiency score 58, estimated 6.9 tonnes.
Three years, thirteen points, one whole band better. Some of that is real — a solid-walled Victorian house that picks up loft insulation, a better boiler or draught-proofing between assessments genuinely moves up the scale, and a 25% fall in modelled CO₂ is exactly what a modest retrofit looks like on paper. Both certificates agree the ceiling is high: the 2024 assessment puts the potential rating at B, score 84, if the remaining measures were done.
But look closer and the two assessors didn't even agree on what they were measuring. The 2021 certificate records the house as built "before 1900" with a floor area of 142m². The 2024 certificate calls it "1900–1929" and 144m². Same house, same walls, two different construction ages and two different floor areas — because an EPC is not a survey, it is a modelled estimate made by a human being walking round for twenty minutes with a clipboard and a set of assumptions. Change the assumed age band and you change the assumed wall construction, and the SAP score that underpins the letter shifts underneath you.
None of which makes the certificate useless. It makes it a snapshot with an author, and the honest way to read one is as a direction of travel, not a verdict — which is the case we make in full in home energy ratings, honestly. For this house the direction is good: it is improving, it has headroom to a B, and its running costs are falling. The listing said none of that. It couldn't — a listing shows you the current letter, not the two certificates that argue about it.
3. The flood question everyone forgets to ask
Ramsgate is a harbour town, and "harbour town" is exactly the phrase that should make a buyer open the flood map before they fall in love. So we did.
The answer for this house is reassuring, and specific: it is not in a flood zone. Not Flood Zone 3, not Zone 2, not on the edge of one. The nearest Environment Agency flood zone — a Zone 2, the "medium probability" band — begins 752 metres away, down towards the water, with the higher-risk Zone 3 about ten metres beyond that. On foot that is the difference between the streets that climb away from the harbour and the low ground that hugs it, and it is the kind of distinction a postcode can't make for you: two homes a five-minute walk apart, one with a flood-map problem and one without.
This is worth dwelling on because "checking flood risk" is usually treated as a yes/no box, and it isn't. The flood zones are a planning tool built from river and coastal modelling; they are the right first question and a poor last one. They don't model surface-water ponding, drainage, or what the sea will be doing in 2070. What they can tell you cleanly, per address, is whether the mapped fluvial and tidal risk touches your specific plot — and for this house, today, it doesn't. That is a genuine tick in the column, and it is the sort of thing we walk buyers through in how do I check flood risk before buying a house. It is also, for the record, part of why the house sold at the top of its range rather than the bottom.
4. What the neighbours were allowed to build
Here is where the public record gets genuinely useful, because planning history is predictive in a way almost nothing else is.
Our house sits inside a conservation area — the point falls squarely within a Thanet conservation-area boundary in the Historic England dataset. (Amusingly, that same national dataset doesn't publish the area's name — the field reads "no data available for publication" — which is a small, honest reminder that even the official record has gaps.) A conservation area is not a museum; it doesn't freeze the house. But it does change the rulebook: it can strip out some of the permitted development rights you'd have elsewhere, put the front elevation, the roof line and the materials under closer control, and — where an Article 4 direction applies — mean you need consent for things that would be automatic on a 1990s estate.
So does that make it hard to extend? The record says the opposite — as long as you extend in the right place. On this one postcode, four full planning applications have been decided since 2020, and all four were granted:
| Decided | What | Outcome |
|---|---|---|
| Dec 2020 | Single-storey rear extension + raised terrace | Permitted |
| Jan 2022 | Single-storey rear extension + new fenestration | Permitted |
| Sep 2022 | Dormer window to rear roof slope | Permitted |
| Dec 2024 | Single-storey rear extension + terrace | Permitted |
Read the descriptions and a clear pattern emerges: rear extensions, rear dormers, work that adds space without touching the street scene the conservation area exists to protect. Four applications, four approvals, every one of them at the back of the house. That is exactly the deal a conservation area offers — considerable freedom behind the building line, real scrutiny in front of it — and it is why the "which councils refuse the most extensions" question has such a spread; we ranked 46 of them in that study. For a buyer, this is the difference between guessing whether you could add a kitchen-diner and knowing the identical application was approved next door two years ago. If you want to know what your own address is allowed, that is precisely the question behind do I need planning permission to build an extension.
For completeness: the house itself is not listed — it doesn't appear in the listed-building register — though it is in good company. The nearest listed building stands about 220 metres away. Close enough to shape the character of the streets; far enough not to add listed-building consent to your renovation paperwork.
5. The crime number that lies by omission
Now the number most likely to be quoted at you out of context. In the twelve months to March 2026, police recorded 594 crimes within 500 metres of this house. Stated baldly, that sounds alarming, and it is exactly the sort of figure that gets pasted into a "worst places to live" list.
Read the composition and it says something completely different.
| Crime type | Count (500m, 12 months) | Share |
|---|---|---|
| Violence and sexual offences | 227 | 38% |
| Shoplifting | 101 | 17% |
| Anti-social behaviour | 70 | 12% |
| Criminal damage and arson | 44 | 7% |
| Other theft | 31 | 5% |
| Drugs | 29 | 5% |
| Vehicle crime | 25 | 4% |
| Public order | 21 | 4% |
| Burglary | 10 | 1.7% |
| Everything else | 36 | 6% |
A 500-metre circle around this house reaches into Ramsgate's town centre, and it shows: 101 of the 594 crimes are shoplifting — a retail-and-high-street signal, not a residential one — and the large violence-and-public-order counts are the fingerprint of a town centre with pubs and footfall, concentrated where the people are rather than where the houses are. Meanwhile the crime a homeowner actually lies awake about, residential burglary, accounts for ten incidents in a year across that whole circle — 1.7% of the total.
That is the number the headline hides. "594 crimes" and "10 burglaries" are the same dataset describing the same place, and they lead a buyer to opposite conclusions. The lesson isn't that the area is safe or unsafe — it is that a single crime count is close to meaningless without its composition, and that the radius you draw decides the answer. Pull the circle in to the residential streets and the profile calms; push it to the harbour and nightlife and it lights up. This is the entire argument for reading area data at street level rather than postcode level, which is what how do I research a neighbourhood before buying a house — and the longer piece on researching a property's area — are about.
6. The building itself
Strip away the map layers and there is still the house: a semi-detached home of roughly 142–144m², built around the turn of the twentieth century — the two certificates can't agree whether it went up before 1900 or in the 1900–1929 band — heated by mains gas. For its type that is generous — comfortably larger than the sector's typical semi, which is a large part of why it trades at detached-house money.
The construction era carries the single most important fact about how it will behave. A house of this age is a solid-wall building — brick straight through, no cavity to fill — which is why its EPC starts lower than a 1990s house and why the cheap win (cavity-wall insulation) simply isn't available to it. The route from D towards its potential B runs through the harder, more expensive measures: internal or external wall insulation, better glazing, and eventually moving off gas. That is not a criticism of the house; it is the honest brief for whoever owns it next, and it is knowable before you offer, from two data points the listing will never print: the age band and the fuel.
(One limit worth stating plainly: no usable mapped building footprint was available for this address, so the floor areas here come from the EPC record rather than a measured footprint. Where we don't have a figure, we say so rather than invent one — the same rule that governs everything above.)
What the listing didn't tell you
Put the six answers side by side and a portrait appears that no single field could give you. A large Victorian semi, above its local average on price and earning that premium: dry ground, a genuinely improving energy record with real headroom, a conservation-area setting that protects its street and — the planning record proves it — still welcomes a rear extension. Its one honest caveat is a town-centre crime count that looks frightening until you read what it is made of.
None of that was hidden. Every figure in this piece came from a public dataset that existed while the property was on the market — the Land Registry, the EPC register, the Environment Agency, the local planning authority, the police, OpenStreetMap. The problem was never that the information didn't exist. It is that it lives in six different registers, written in six different dialects, and nobody hands you the whole set stapled together. The listing gave you forty words. The record gives you the house.
That is the entire job of Ask the House: put one address in, and read back all six of these layers in plain English — the same public record, joined up, for any UK home. You can try it on a property you care about, or explore the platform first. And if you'd like the next house in the series to be a type you're weighing up — a new-build, a flat, a rural detached — that is exactly the kind of house we'll pull apart next month.
Methodology & limitations
Every figure in this piece was checked against the named public record for a single property. The address is withheld, and the methods and limitations are stated below so the findings can be assessed without exposing the property or our internal systems.
- Price: six completed Land Registry transactions from 1996–2026. Local context uses sales in the same postcode sector since 2024, grouped by property type — semi-detached median £350,000 (n=41), detached median £425,000 (n=11). Sold-price records lag the market by weeks to months.
- Energy: the property's two EPC certificates, lodged in July 2021 and October 2024. EPC bands are modelled estimates, not measurements; the assessments disagree on construction age and floor area, as discussed in the body.
- Flood: the property's mapped location was checked against Environment Agency planning flood zones and the distance to the nearest zones measured — Zone 2 at 752m and Zone 3 at 763m. These zones cover river and coastal flooding, not surface water or future sea-level scenarios.
- Planning: four published applications in the property's postcode from 2020–2024, all granted. Conservation and listed-building checks use published Historic England and local planning records.
- Area / crime: 594 open police crime reports within 500m during April 2025–March 2026, grouped by offence type. The radius reaches the town centre; these are reports, not convictions, and composition matters more than the total.
- Building: property type, construction age, floor area and fuel come from the EPC record. No usable mapped footprint was available, so the reported areas are EPC values rather than independent measurements.
Where a figure could not be computed, we have said so in the text rather than guessed. That is the standard we hold every one of these to.
Ask the House about any property
Get grounded answers on the risks, value, planning, and energy behind any UK home — plain English, no jargon. Free to try.